Holiday Fun with the Spring Bulbs Investigation
, 25 Gorffennaf 2024
The Spring Bulbs for Schools Investigation has died down until September, when we will be welcoming our new schools and introducing them to the project.
But there’s lots of fun that can be had over the summer! Explore our website to find activity sheets and games that you can play at home. The origami booklet and Kahoot quizzes are my favourites!
There’s more to explore on the Amgueddfa Cymru Learn pages and the Edina Trust website.
Why not have a go at some of our Kahoot quizzes now? Just click the links below to explore!
Quiz 1: When will our daffodils flower 2024?
Compare weather data for 2023-24 from across the UK and against previous years to predict when daffodils will flower. What do plants need to grow? Which country was the warmest / coldest? Which country had the least rain?
Quiz 2: Bulb Project Quiz 2023-24 Level 1
Study bar graphs to deduce which were the wettest and warmest countries. Answer questions about plants. Discover which countries had the most and least rainfall. Discover which countries had the highest and lowest temperatures.
Quiz 3: Bulb Project Quiz 2023-24 Level 2
Study bar graphs to deduce national trends in temperature and rainfall. Study units carefully to calculate average monthly rainfall records for Wales, England, Scotland and Northern Ireland. Work out the monthly temperatures for Wales, England, Scotland and Northern Ireland. Answer general knowledge questions.
Quiz 4: Compare weather records from different years
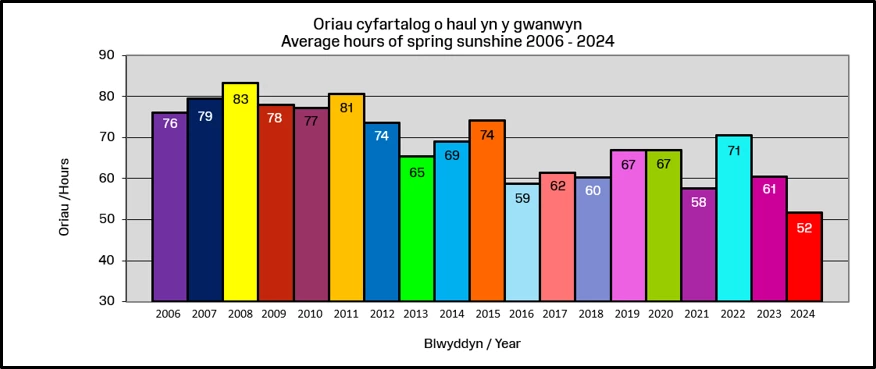
Study line and bar chats to look for trends in the weather data. Order countries from warmest to coolest. See which years had the most and least rainfall. Deduce which years had the most hours of sunshine.
Study line and bar charts to look for trends in the flower data. Answer questions about average weather readings. Sort years from earliest to latest flowering dates. Study bar charts to see whether plants flowered earlier or later than expected.
Study line and bar charts to look for trends in the weather data. Study line graphs to pick out high and low monthly average temperatures. Study line graphs to answer true or false questions about monthly rainfall. Study Bar charts to order years from warmest to coolest.
Study bar and line graphs to determine whether our data shows patterns for the flowering dates of spring bulbs. Use tables to deduce which years saw plants flower earliest. Study combination charts to deduce trends in the data. Compare findings from different charts to see if there are patterns that explain anomalies in the data.
Have fun Bulb Buddies,
Professor Plant


